RideSense for Government.

SOLUTIONS
Benefits for Government
Leverage nationwide data to monitor vehicles, analyze accident trends, and assess road safety impacts with our National Dashboard.
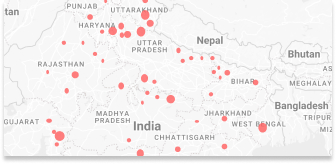
Nationwide Vehicle Monitoring
Comprehensive data on the total number of vehicles equipped with RideSense technology.

Make Data-Driven Safety Decisions
Access actionable insights from our leading analytics platform to enhance road safety and operational efficiency.
Secure Your Fleet with Advanced Protection
Protect your vehicles and data with robust security technology, ensuring the safety of your fleet and sensitive information.
Enhance Collaboration and Communication
Enable real-time incident reporting and driver feedback to improve team collaboration and safety responsiveness.
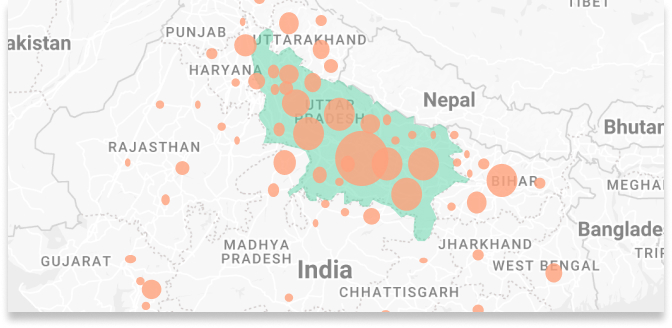
Streamline state-level traffic operations with detailed vehicle tracking, accident statistics, and violation management using our State Dashboard.

Comprehensive Vehicle Tracking
Detailed data on the total number of vehicles across the state equipped with RideSense technology, enabling real-time monitoring and safety management.
State Accident Statistics
In-depth state-level statistics on road accidents, including fatalities, injuries, and their distribution across various regions.
Interstate Vehicle Movements
Monitor and report vehicles leaving the state of registration, with granular data down to each Regional Transport Office (RTO).
Interstate Traffic Violations
Integration with a National Traffic Ticket Management System, allowing the state to seamlessly issue and manage traffic tickets for vehicles registered in other states through secure APIs.
Traffic Violation Categorization
Systematic classification of accumulated fines into minor, major, and severe categories based on frequency, nature, and monetary value, empowering authorities to pause, train, or suspend dangerous drivers.
Driver Behavior Insights
Aggregated insights on driver behaviors statewide, distinguishing between positive, defensive, eco-friendly, and illegal driving patterns.
Trend Analysis
Year-over-year analysis of accident rates and driver behavior improvements, providing a clear picture of progress and areas needing attention.
High-Risk Zones
Identification of high-risk areas prone to accidents or frequent negative driving behaviors, guiding focused safety initiatives.
Geo-Fenced Monitoring
Summary of geo-fenced areas within the state, highlighting zones with recurrent violations or elevated accident rates for enhanced enforcement and safety measures.
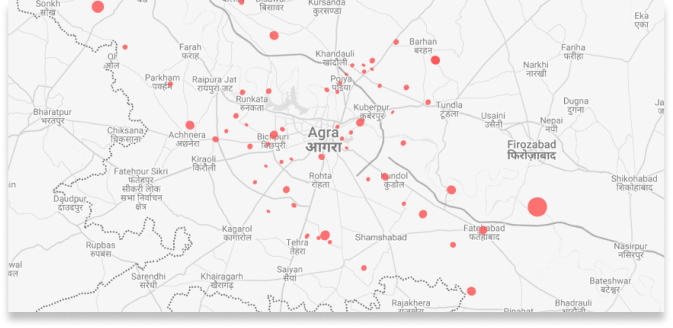
Focus on local road safety with detailed vehicle data and accident insights through our Regional/Zone-Level Analysis tools.
Local Vehicle Tracking
Comprehensive data on the total number of vehicles in the district equipped with RideSense technology, enabling effective local monitoring and safety enforcement.
Regional Accident Statistics
Detailed statistics on accidents, fatalities, and injuries within the district, providing insights for targeted safety measures.
Accidents and Incidents
In-depth reports on accidents and incidents, categorized by specific regions or zones, to assist in localized response and prevention efforts.
Traffic Violation Categorization
Classification of traffic fines into minor, major, and severe categories based on frequency, nature, and amount, empowering authorities to take corrective actions such as driver training or license suspension.
Parking Violations & Road Usage
Comprehensive analysis of parking patterns, legal vs. illegal parking zones, zebra crossing adherence, and overall road usage within the district to improve compliance and safety.
High-Risk Zones
Identification and continuous monitoring of accident-prone areas within the district, enabling proactive measures to reduce incidents.
Traffic Flow Optimization
Detailed analysis of traffic patterns and driver behavior data, providing actionable insights for optimizing traffic flow and reducing congestion in key areas.